NICK PANNERI, CFE
 
  • Home

Using Splunk to Help Identify 3rd Party Relationships

1/7/2017

0 Comments

 
When it comes to 3rd party relationships, sometimes you don’t know what you don’t know. But turning a blind eye isn’t an option. There are significant risks when 3rd party relationships are not approached thoughtfully by the operators of your business. For example, are your employees providing them with PII data? Are your employees being given user IDs and passwords to log into the 3rd party websites? Is that log in information secured and is access to the sites removed when employees transfer or are terminated? Those are just a few of the many risks that can exist. 

Surveying employees and asking them to identify 3rd party relationships is one approach but chances are it may not give you a complete picture. An independent approach to identification is a good way to complement taking surveys.

By analyzing your unstructured data, in particular your firewall logs, you can determine which websites are being accessed by multiple employees. You can then visit those websites to determine if they might indicate 3rd party relationships. For example, if the websites are providing a service and require a user id and password then that might be an indicator of a 3rd party relationship. This can be accomplished with the following Splunk command:

    index=“<name of firewall index>” <domain name field>=“www.*” [inputlookup <name of          lookup file> | fields <employee identifier> as user] | stats dc(user) as unique by <domain         name field> | where unique > 2

We can break this command into several parts:

index=“<name of firewall index>” — This will access the index that contains your firewall logs. The name of the index may be unique to your organization and a discussion with your IT department can help to identify it.

<domain/host name field> = “www.*” — You will need to identify the field that contains your domain name. Again, this will likely be unique to your environment. This part of the command will identify the websites you’re interested in.

[inputlookup <name of lookup file> | fields <employee identifier> as user] - You will need to create a lookup (.csv) file that contains the identifier of the employees you want to review as it appears in your logs.  This will likely be a list of employee IDs. This part of the command will use your .csv lookup file to filter the search to just the set of employees your focused on (for example, a particular business unit).

stats dc(user) as unique by <domain name field> - Here you will use your domain name field and the employee identifier to determine how many unique employees are accessing each website. The resulting field is named as ‘unique’.

where unique>2 - This will limit the results to only those websites where at least two different employees accessed the site.  The assumption here is that websites representing a 3rd party relationships would likely be accessed by multiple employees at your organization.
The results of this search will appear similar to the table shown below.
Picture
Good luck with your Splunk searches!
0 Comments

Using Time Intervals in Tableau

12/23/2016

0 Comments

 
To effectively plot dates and times in Tableau you sometimes need to do some prep work.  In this example we concatenate a ‘Date’ and ‘Start Time’ field and then we use intervals to ‘bucket’ the records into 15 minute time slots. 
Picture
Picture
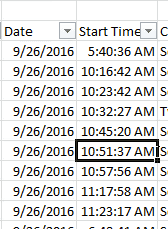
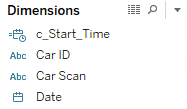
In the above screenshot you can see the ‘Date’ and ‘Start Time’ fields that we will be concatenating. Begin by creating a calculated field:

  1. Select Analysis —> Create Calculated Field
  2. In the ‘Name’ text box, enter a name for the calculated field.
  3. In the ‘Formula’ text box, enter the formula below:

     DATEADD(
    ‘hour’, DATEPART(‘hour’, [Start Time]), DATEADD(
    ‘minute’, DATEPART(‘minute’,[Start Time]), DATEADD(
    ‘second’, DATEPART(‘second’,[Start Time]), [Date])))

The ‘Date’ and ‘Start Time’ columns are now combined into a single field.
Picture
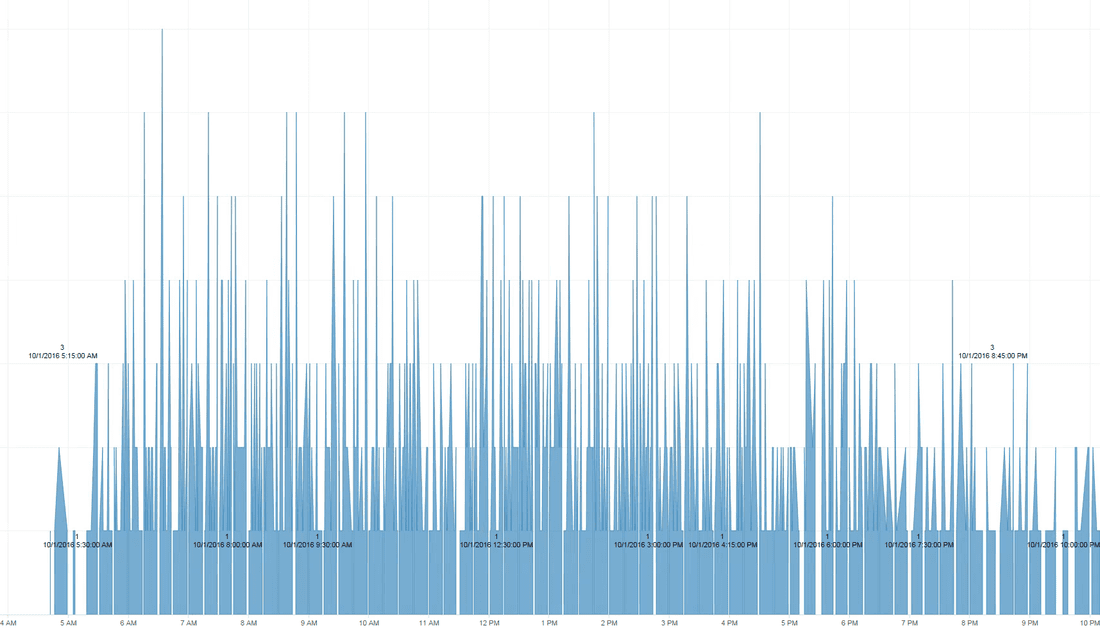
In the above screenshot you can see how the data appears in the visualization. It's super busy, and perhaps it’s not very meaningful to visualize each minute of each day on a chart. So, you can then use more calculations to ‘bucket’ those records into 15 minute intervals.

To calculate your intervals, use this simple binning technique: There are 24 hours/day * 60 min/hr / 15 min bins = 96 bins.

Create a calculated field using this formula:

    DATETIME(INT(FLOAT([Datetime])*96)/96)​

and voilà……
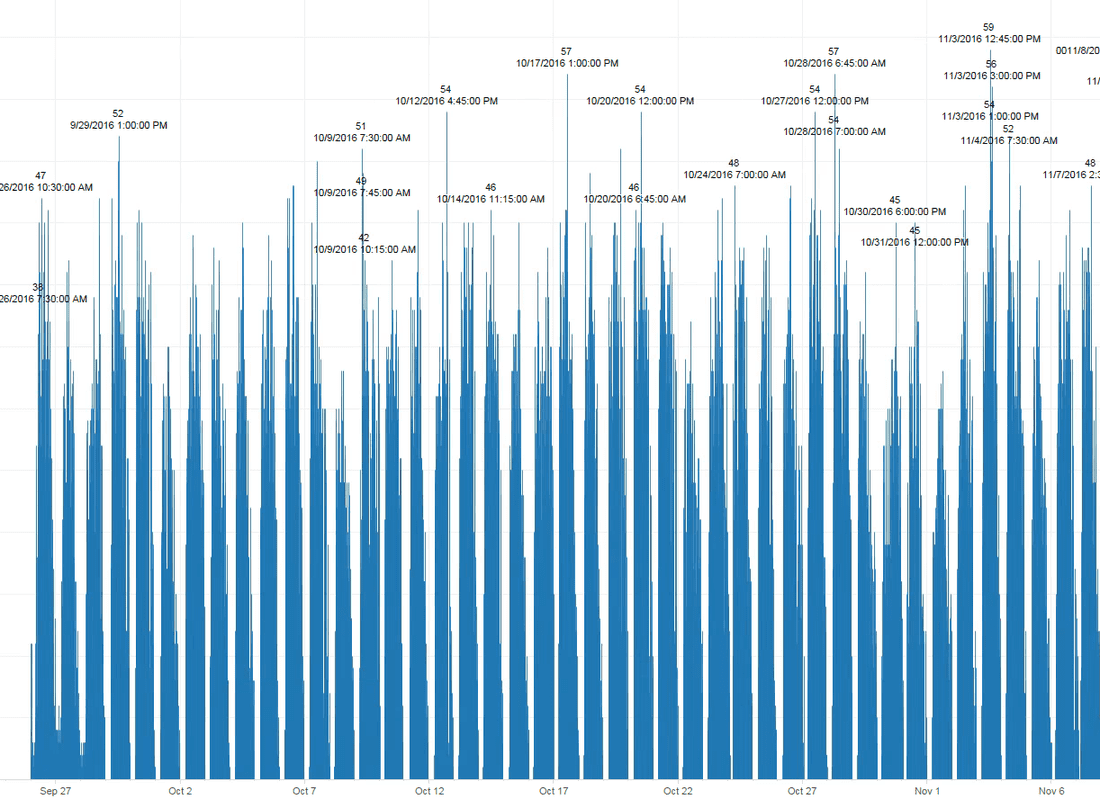
Picture
Now you can visualize more dates and clearly see the trends and spikes in activity.
0 Comments

ACL v12 is here and WOW!

9/14/2016

2 Comments

 
ACL has released their webinar to demo ACL v12 (Click Here) and I have to admit it’s a slick upgrade. After moving on to larger and larger datasets, ACL kind of lost some relevance/power compared to tools like SQL Server. But boy does it look like they’ve started to turn the ship. Let’s recap some of the most significant enhancements:

  • Direct Database connectors: Hive anyone? MongoDB? Cassandra? As a matter of fact, there are 16 new direct connectors to various databases that have gained in prominence over the years. No more uploading all those .CSV files - woohoo!
  • Application Connectors - Connect directly into your Salesforce application. Very interesting. Even with v12 it doesn’t seem like they have a whole lot of application connectors but @DanZitting, ACLs Chief Product Officer, promised more to come in future releases.
  • Joins on the database side - What??? This has been one of the biggest ‘missing’ features of ACL. As a matter of fact, in my mind, it’s one of the main reason users have migrated to other analysis tools. So, if your tired of importing 20GB tables into ACL only to filter out half the data farther down the line then you’re in luck!
  • Analysis and Visualization upgrades:
    • Access ACL projects directly from Tableau
    • Run R and Python code directly from within your ACL expressions. Tableau integrated this into their recent version and i’m glad to see ACL jumping on the bandwagon.

Wow, what a release. As good as all of this is, it just might be that ACLs biggest home run has been pairing up Dan Zitting as Chief Product Officer and Keith Cerny as Chief Technology Officer. If they were the driving force behind some of these changes then they get a big round of applause from me!

So, if you use ACL then this is one upgrade cycle you won’t want to miss!
2 Comments

Fixing NULL Dates in Tableau

8/30/2016

0 Comments

 
If you’re working in Tableau and using ‘live’ connections to SQL databases then you may have come across an issue where dates/times coming from SQL Server are appearing as NULL in Tableau.  I’ve pulled some resources together for hopefully a quick fix:

  • Tableau Knowledge base Post:  this post walks through reasons why your dates may be NULL and some options for using DATEPARSE along with an 'Extract' connection (rather than a live connection) to fix the issue.
    • The official ‘answer’ for this issue: The date/time field from the live data source is of type string. When using a live connection, Tableau Desktop relies on the remote database to perform the conversion from string to date or datetime. Because most databases do not handle these conversions uniformly, Tableau Desktop is unable to enforce a standard behavior.
  • Microsoft DATETIME2 Post:
  • ICU User Guide ​Post:  in my case, I particularly had an issue with a live connection to a SQL database using this date type.  These posts discuss the possible syntax you can use to describe the date in the Tableau DATEPARSE function you need to create
  • Tableau DATEPARSE Example:
    • My SQL Server date field was in this format:  2016-08-30 15:00:00.0000000
    • Here’s the Tableau DATEPARSE function I was able to create to successfully interpret the date:  DATEPARSE (“yyyy-MM-dd hh:mm:ss.0000000”, STR([DATETIME2_FIELD]))
The obvious downfall with this option is that it requires a copy of the data hosted locally.  When running Tableau desktop, it seems to also slow down performance. Hope this helps and good luck with your date fields in Tableau!

​
0 Comments

Common Mistakes to Avoid with your Audit Analytics Program

2/15/2015

0 Comments

 
  • Whatever your tech tool(s) don’t train everyone at once.  I know, I know, it sounds great to train your entire team and have an army of analytic professionals!  The reality is only certain employees will embrace the new technology, especially when it’s analytic software.  So, spend your money on the few employees having shown an interest/aptitude for technology tools.
  • Once you have someone trained move them immediately to a project where they can use their new knowledge.  Try not to make the project second priority to other audit work.  If your employees can’t apply their new knowledge soon after training then they will likely lose what they’ve learned.
  • You can get lost in the data so concentrate on the obvious findings.  As you start, don’t spend months and months analyzing the same set of data for every possible angle of fraud, waste or abuse.  The reality is 80% of your findings are going to come quickly as you investigate the obvious fraud red flags.  From an ROI perspective, it’s better to get through multiple projects while focusing on the big/obvious issues than completing only one project because you’ve spent so much time turning over every rock.
Good luck!
0 Comments

Encourage Audit Innovation with your own ‘Skunkworks’ Project…..

7/25/2014

0 Comments

 
Sometimes the best ideas come from sitting on the beach or next to the pool with a drink in hand while letting your mind run free.  A week later, when you are back at work and excited to put that great idea into practice, reality sets in and you never get around to it.
How many great and creative ideas get lost like this?  Probably at least one or two each year for every person on your team.
Capitalize on these ideas with your own Internal Audit ‘Skunkworks’ project!  Pick a day for your team to go offsite and work on any project of their choosing.  Here are a few guidelines you might find helpful:
  • Don’t make participation mandatory
  • Not every project will be a success so make sure your team understands it’s okay if their project doesn’t pan out
  • Devote at least an entire day to your event
  • If possible, hold the event offsite where employees can dress down and won’t be bothered by phone calls or other office distractions
  • Have each participant hold a short presentation on their projects and results the following day
  • Provide breakfast and lunch on-site so your team has more time to devote to their projects
  • To ensure efficient use of time, have your team do any necessary legwork ahead of time
Good luck with your ‘Skunkworks’ project!  I’d love to hear about success stories or lessons learned from those of you having done something like this!
0 Comments

Do You Have a Growing Analytics Program? Watch out!

7/24/2014

0 Comments

 
From my perspective there are 5 core areas to anticipate challenges when growing your audit/fraud analytics program: Technology, Talent, Project Management, Bugs and Standards.
  • Technology: Your analytics program will likely start out with tools such as Excel or some other audit analytic software (ACL, IDEA, Arbutus). But it’s possible you may come to a point where these technology solutions aren’t as effective as they used to be. Most likely this will happen as you begin to greatly expand your continuous monitoring program or develop a need to frequently access your organizations large transactional databases. So, always be on the look out for new technologies that can take your team to the next level. Tools like SQL server, SAS, Business Objects are a good start.
  • Talent: As you move into bigger tools you will also need a bigger investment in people. Managing data will be important and folks with previous experience in database development, extract-transform-load (ETL) processes and data analysis will be unbelievable helpful. If using Microsoft tools, someone having a certification like the Microsoft Certified Technology Specialist (MCTS) would be good. You will also need folks with experience analyzing data. Business Analysts from varying parts of your organization often have the unique combination of business and data knowledge needed to be effective at this job.
  • Project Management: Great news! You’ll find you get a lot more done with a bigger team and better tools. Unfortunately, this means you’ll have many projects open at any given time and your processes for managing them will have to change. Social themed project management software like Zoho, LiquidPlanner, AgileZen are good to check out.
  • Bugs: I know! I know! You told yourself your reports will never breakdown or have issues like the ones put out by your organizations IT department. Well, I have some bad news for you: It’s going to happen. You’re going to make the greatest continuous monitoring reports your department has ever seen and just when you think all is great they’re going to break. Mostly likely because the source data you’re using is constantly being changed/updated by IT for various reasons. If you’re lucky, they’ll let you know but probably they won’t. And that gets us to the final area……
  • Standards: Standards will be necessary to ensure you create quality products that can be efficiently managed. They will be necessary to help prevent bugs in your reports and to alert you when something has broken.
Good luck with your expanding analytics program!
0 Comments

Data Analytics in the Spotlight @TheACFE Fraud Conference

6/18/2014

0 Comments

 
I have to say it’s refreshing and exciting to see data analytics garnering more attention this year at the National ACFE conference!
In multiple breakouts I was hearing the same terms over and over: “Hadoop” , “Big Data”, “Unstructured Data”, “Video Analytics”.  This is the cutting edge of fraud detection and I’m happy to see the ACFE embracing these topics.
Fraud analytics are not going away anytime soon.  For as much as was mentioned at the June 2014 conference there are many other topics to be covered.  From other analytic tools like R and Python, the use of Application Programming Interfaces (API’s) to analyze social media outlets like Twitter, Facebook and YouTube and diving even deeper into the mathematical theories used to detect fraud (beyond Benfords Law and into other mathematical models such as Levenshtein Distance, machine learning, etc).
For those interested in learning more in these areas I’ve put together some resources you can check out:
Websites:
  • www.datasciencecentral.com
  • www.analyticbridge.com
  • www.informs.org
  • www.wikipedia.org
Free Analytic Tools:
  • R http://www.r-project.org
  • SQL Server Express http://www.microsoft.com/web/platform/database.aspx
  • Python https://www.python.org
Twitter:
  • Cynthia Hetherington @HetheringtonGrp
  • Informs @Informs
  • Big Data Science @analyticbridge
  • Data.Gov @usdatagov
…..and if you go through all the trouble to add those to your Twitter feed then add one more just for fun…..@jimmyfallon
0 Comments

Video Analytics – A New Frontier in Fraud Detection?

6/13/2014

0 Comments

 
So, everyone is using SQL, R, and SAS to analyze data to detect fraud.  What’s next?
There’s a great @analyticbridge blog post by Vishal Sharma about video analytics and it doesn’t take much vision to see its application in the area of fraud detection.  Think about the London bombings in 2005 for which surveillance cameras provided vital breakthroughs in the hunt for the bombers.  Now, combine this kind of surveillance footage with some advanced analytics and imagine software that is able to ‘understand’ when a crime is occurring and call police.
Vishal discusses four capabilities that sound like invaluable tools for fraud detection:
  • Motion Detection:  Used to determine the presence of observed motion in the scene
  • Object Detection: Used to determine the presence of a specific object or entity (a car, a person, etc)
  • Video Tracking:  Used to determine the location of an object or person in the scene, sometimes in reference to another fixed point
  • Pattern Recognition:  Software can be programmed to identify objects and should they change or move in a specific way (i.e., go missing or new objects appear) then the proper authorities could be alerted
For example, regarding pattern recognition, imagine a retail store being able to identify when a loading dock door is opened AND inventory is then loaded into a personal vehicle.  Video analytic software could pick up on this ‘red flag’ and immediately alert authorities.  Traditional data analytic tools (SQL, SAS, etc) might have been able to identify this theft…….days or weeks later.
Are you using video analytics?  Leave a comment below!
0 Comments

Lucky? Or Too Lucky? Potential Fraud in the Lottery……

7/13/2013

0 Comments

 
Picture
So, how much is too much when it comes to winning the lottery?
​
One of the cool things about the Missouri lottery program is that they publish all scratchers winners of $1,000 or more on their website. My students from a recent Fraud Examination class applied some basic fraud detection analytics to the data and they found some interesting trends:


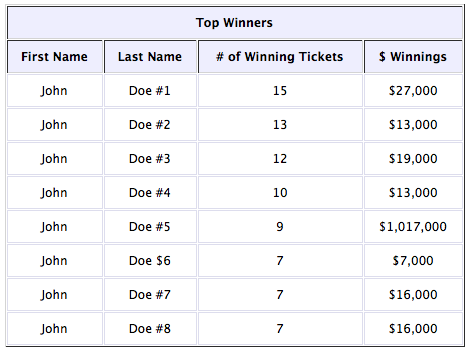
The most obvious trend among all Missouri scratchers winners was with John Doe #1. In the 21 months of data, this person redeemed 15 winning scratchers tickets of $1,000 or more, for total winnings of $27,000.

Playing the Odds: Missouri publishes the odds of winning each game on their website. Calculations show that a person playing the odds would need to buy roughly 37,000 scratchers tickets in $20 denominations ($20 games have the highest frequency of $1,000 winning tickets) to guarantee themselves 15 winning scratchers of the $1,000 denomination. This would cost the person about $752,000 (vs. the $27,000 actually won). Interestingly enough, at three minutes per ticket, it would take about 77 days to scratch them all off!

Luck: If winning at this regularity is due to a ‘lucky streak’ then, at 21 months and counting, it is surely a great lucky streak! Who knows, it might even be enough to question the process of evenly distributing winning tickets throughout the state?

Of course, the worst case scenario would be a scheme in which a person has discovered a way to de-fraud the lottery scratchers program.

So – what do you think? Is it possible to de-fraud a scratchers lottery program? What could be done to prevent it?

0 Comments
<<Previous
    The views expressed in this blog are mine and do not necessarily reflect the views of Enterprise Holdings, Inc.

    Archives

    January 2017
    December 2016
    September 2016
    August 2016
    February 2015
    July 2014
    June 2014
    July 2013
    June 2013
    January 2013
    May 2012

    View my profile on LinkedIn

    RSS Feed

  • Home
  • Blog
Powered by Create your own unique website with customizable templates.